Sometimes, in life, your journey intersects with your professional pursuits. It's a rare occurrence, but this week was one of those moments for me.
My family faced two significant events. Firstly, my youngest, a 12-year-old, received his high school advice (a peculiarly early practice in the Netherlands). His initial recommendation for high school, akin to a 'pencil advice', was adjusted upwards, which was beneficial for him and marked a pivotal moment in his life.
Then, on Friday, we dealt with the transition of our family home, where my mother resided for 47 years, and my sisters and I grew up. Walking through its now empty rooms felt surreal, with memories etched into every corner. For instance, I still recall the precise steps to skip when returning home late and not wanting to wake my parents. Strange to remember when the new buyers (a young couple) and the real estate agent were walking behind me. While it was an odd experience for me, for my mother, it was a significant milestone — accepting that she could no longer tend to the garden or remain in the place she cherished due to her battle with dementia.
Coincidentally, amidst these personal reflections, I delved into the World Happiness Report, which analysed global happiness trends and scores and highlighted disparities across age groups. While subjective assessments of happiness serve as just one metric of well-being, they offer valuable insights into people's emotional states. And, in the end, should economics not be about well-being, for now and in the future?
What I found out is that happiness is increasingly decoupled from economic growth in rich countries. Also, in rich countries, younger people are the least happy, while the oldest are the happiest—an anomaly that says something about our welfare states.
Also, this week, a new paper was published, clearly showing the growth imperatives in current economies. Growth-dependent systems that run into trouble, and (that is what I was trying to find out) do grow but do not deliver happiness in richer countries.
On a personal note, I realize that my son has probably gone through a relatively unhappy period (since in Western countries, COVID-19 depressed especially younger generations). However, he still lives in a country where people are relatively happy. This is particularly true since his school advice has been upgraded (as higher education correlates with higher subjective well-being). Conversely, for my mother, although she is part of the ‘happy generation, the progression of dementia signifies a decline in subjective well-being.
As for myself, I acknowledge that I've likely weathered the storm of my most challenging years in terms of subjective well-being (the U-shape happiness pattern in most countries, with a dip at around fifty). And always the rescue for an individual: Averages fail to capture the intricacies of individual experiences.
A long read again…
Enjoy.
Well-being and happiness
More and more social scientists are committed to the view that it is essential and worthwhile to measure well-being, and in an increasing number of countries, policymakers have taken an interest in well-being as a measure for policy development and evaluation. Especially after the financial crisis, it became more in fashion to discuss other measures of well-being and go ‘beyond GDP’. Significant examples include former French President Nicolas Sarkozy, who installed the Commission on the Measurement of Economic Performance and Social Progress, and former United Kingdom (UK) Prime Minister David Cameron, who launched an initiative to measure and promote national well-being in the UK. Nonetheless, well-being is a complex and controversial concept. Scientists and policymakers seem to agree that (national) income (GDP or real disposable income) is not a satisfactory measure of well-being. Still, the debate about how we should conceptualize well-being for policy if we are to go “beyond GDP” and consider broader social and environmental goals is lively and ongoing, with many attempts and alternatives to measure GDP.
My idea is not to give you a complete overview here (you can read, for example, the book of Rutger Hoekstra about replacing GDP for that); a few things are important to interpret well-being.
Two strands of literature have been particularly influential in this debate: the subjective well-being (SWB) -or happiness- approach (started by Easterlin and in the Netherlands Veenhoven) and the capability approach (e.g. Sen and Nussbaum).
The literature on SWB tends to consider people’s evaluations of their lives as good evidence for their well-being but is divided into at least two aspects of measurement. Firstly, whether such evaluations should be about direct experiences of ‘pleasure’ or cognitive evaluations of life differs. Secondly, whether a single unidimensional SWB measure should measure well-being or whether SWB is just one among several dimensions of well-being.
The Global Happiness Report uses the “Cantrill ladder” of self-reported happiness and a single unidimensional SWB measure.1
Another well-being approach is the capability approach. It is more explicit in taking well-being to be inherently multi-dimensional, comprising functionings (i.e., doings and beings) and capabilities (i.e., fundamental freedoms to such functionings that people have reason to value). However, authors within the capability approach are divided into two questions central to formulating a multi-dimensional measure of well-being: First, which capabilities and functions constitute well-being? Secondly, how should these different capabilities and functionings be weighed against each other? In response to the first question, Amartya Sen maintains that the set of functions should be determined by public deliberation. At the same time, Martha Nussbaum has argued for a specific list of capabilities. Considering the difficulty such proposals pose in answering the second question, some authors have used life satisfaction to develop capability-based well-being measures. However, this debate still needs to be settled.
In the meantime, organisations like the OECD have constructed well-being indicators or dashboards based on a capability approach called the Better Life Index. You can play with it on the website. You can adjust the weights of different dimensions of well-being. Then the ranking of countries changes accordingly (in the example below, I played in such a way to get the Netherlands on top - so I had to put low weight on income and environment to get that done).
There are many challenges to making these kinds of dashboards objective. Hence, a subjective indicator is not a bad idea to get a clue about people's performance. Remark, however, that this is about individual well-being. It does not tell anything about how this relates to ecological pressures or, in other words, how sustainable this well-being is for future generations or people elsewhere.
Happy or not
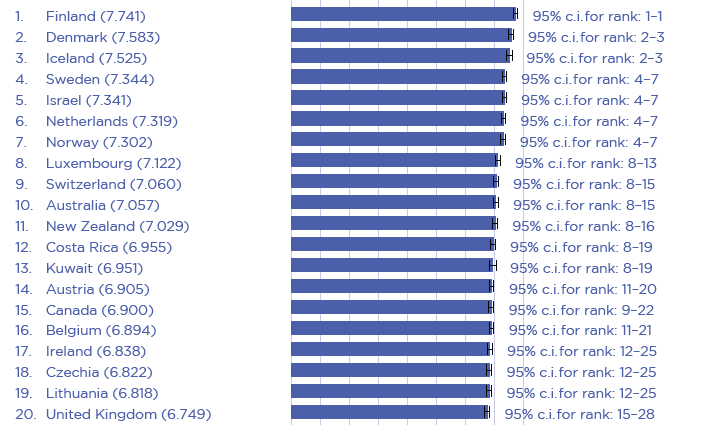
The rankings in happiness are not the most exciting news. For years, they have been pretty stable. The top of the list is occupied mainly by rich Western countries (except Costa Rica and Kuwait), and the bottom is for countries with wars and chaos, like Congo, Lebanon, and Afghanistan.
However, the changes over time are interesting. While on average, happiness did not change that much, between 2005 en 2023 happiness increased especially at the
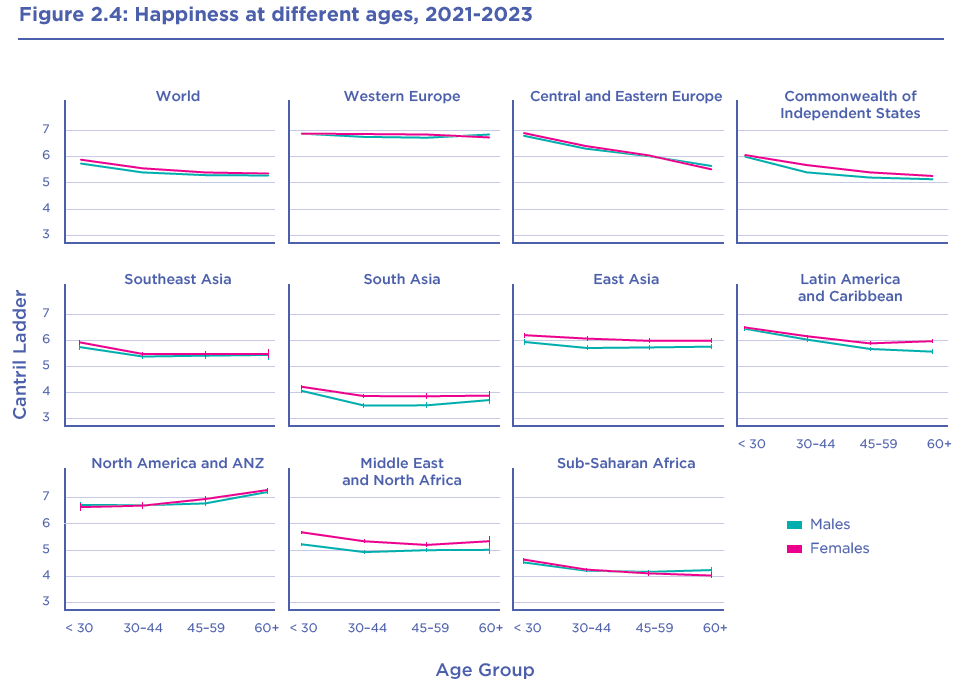
From 2006-2010 to 2021-2023, changes in overall happiness varied greatly from country to country, ranging from increases as large as 1.8 points in Serbia and 1.6 points in Bulgaria to decreases as large as 2.6 points in Afghanistan. Happiness changes also vary by global region. Central and Eastern Europe had the largest increases, of the same size for all age groups. Gains were half as large in the CIS countries. East Asia also experienced significant increases, especially among the older population. By contrast, life evaluations fell in South Asia in all age groups, especially in the middle age groups. Happiness fell significantly in the country group, including the United States, Canada, Australia and New Zealand, by twice as much for the young as for the old. Happiness has fallen from 2006-2010 to 2021-2023 in the Middle East and North Africa, with larger declines for those in the middle age groups than for the old and the young. Global happiness inequality has increased by more than 20% over the past dozen years in all regions and age groups to an extent that differs greatly by age and region.
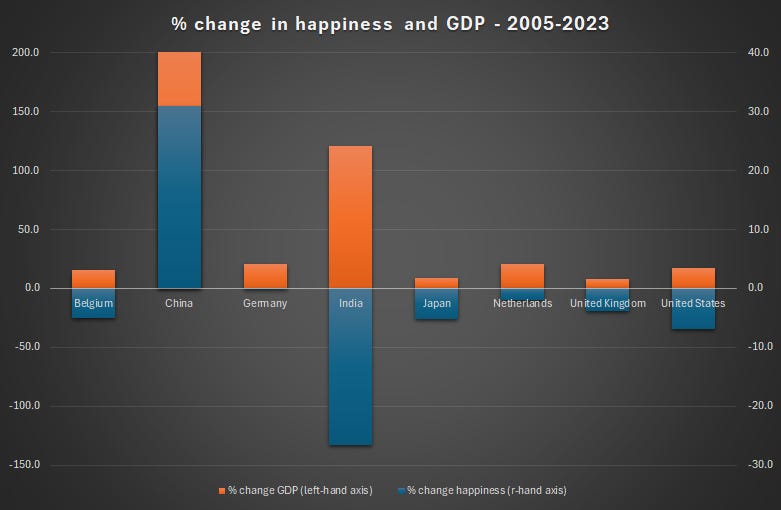
What is not in the model is a question that has always intrigued me: although it is clear that people in wealthier countries score higher on happiness (the table above tells enough), how did the change in happiness evolve over the past 15 years? Can we also say that a change in happiness is driven by GDP growth? To answer this question, I offered my Sunday to do some data crunching: I pooled all the happiness data over 2005-2023, added GDP (and unemployment) data and first looked at the development and correlations for different countries (see figure below).
What is evident when considering these big countries (with some home bias) is that China is the only one that shows positive GDP development and the largest increase in happiness. In contrast, others show a decrease in happiness.
In general (figure below), there is (still) a positive relationship between the change in GDP and the change in happiness, foremost driven by the emerging markets.

So, then, is GDP still a good proxy for subjective well-being?
I hypothesise that we see some material satisfaction or happiness in rich countries. To test that, I performed a simple linear regression of (absolute) change in happiness as the dependent variable and change in GDP + the level of GDP as the dependent variable. Then, it turns out that the higher the GDP at the start, the lower the change in happiness. Also, the change in GDP matters less.2
In other words, more economic growth in rich countries does not lead to happier people. It seemed to be more the other way around.
Age and happiness
A standard assumption in economics is that individuals smooth income during their lifetimes in order to maintain the standard of living (or well-being) over lifetime. Interestingly, if you look at the different figures from happiness at different ages, you see people in Western Europe and East Asie more or less achieving that.
However, it would be normal for younger people to be the happiest; that is a stylised fact in happiness research. In 103 countries, the youngest is still the happiest generation. However, younger generations are now the least happy in countries like Finland, Denmark, Sweden, the Netherlands, Norway, Canada, and Germany, while in 69 countries, the oldest are the least happy.
And in those countries where the younger generations are the least happy, the older generations are the most happy.
It looks like we have some trend here. While in general, happiness differences have increased, it also looks like the development in rich countries is decoupled from that in the rest of the world. Material prosperity is no longer the determinant of happiness, but the other determinants that define wellbeing and can be attributed to an increase in happiness, such as social support, health, freedom to make life choices (agency) and quality of institutions (corruption, etc.).
Therefore, this report also shows that we should discuss growth dependency in rich countries: it does not make us any happier.
Combating growth imperatives
In this recently published paper, the authors outline three compelling reasons to address growth dependencies:
1️⃣ Ecological limitations
2️⃣ Institutional structures, where a sudden GDP decline could adversely affect health and wellbeing
3️⃣ The inevitable decline in economic growth rates in advanced economies, necessitating preparation for a post-growth transition
While I won't delve into the impossibility of reconciling ecological limitations with continued growth at this moment, it's a topic worth exploring in its own right (though this article is also quite interesting and convincing that decoupling between economic growth and carbon emissions will be very difficult).
In essence, growth dependency encompasses:
“Those conditions that require the continuation of growth in order to avoid significant physical, psychological, social, and/or economic harms.”
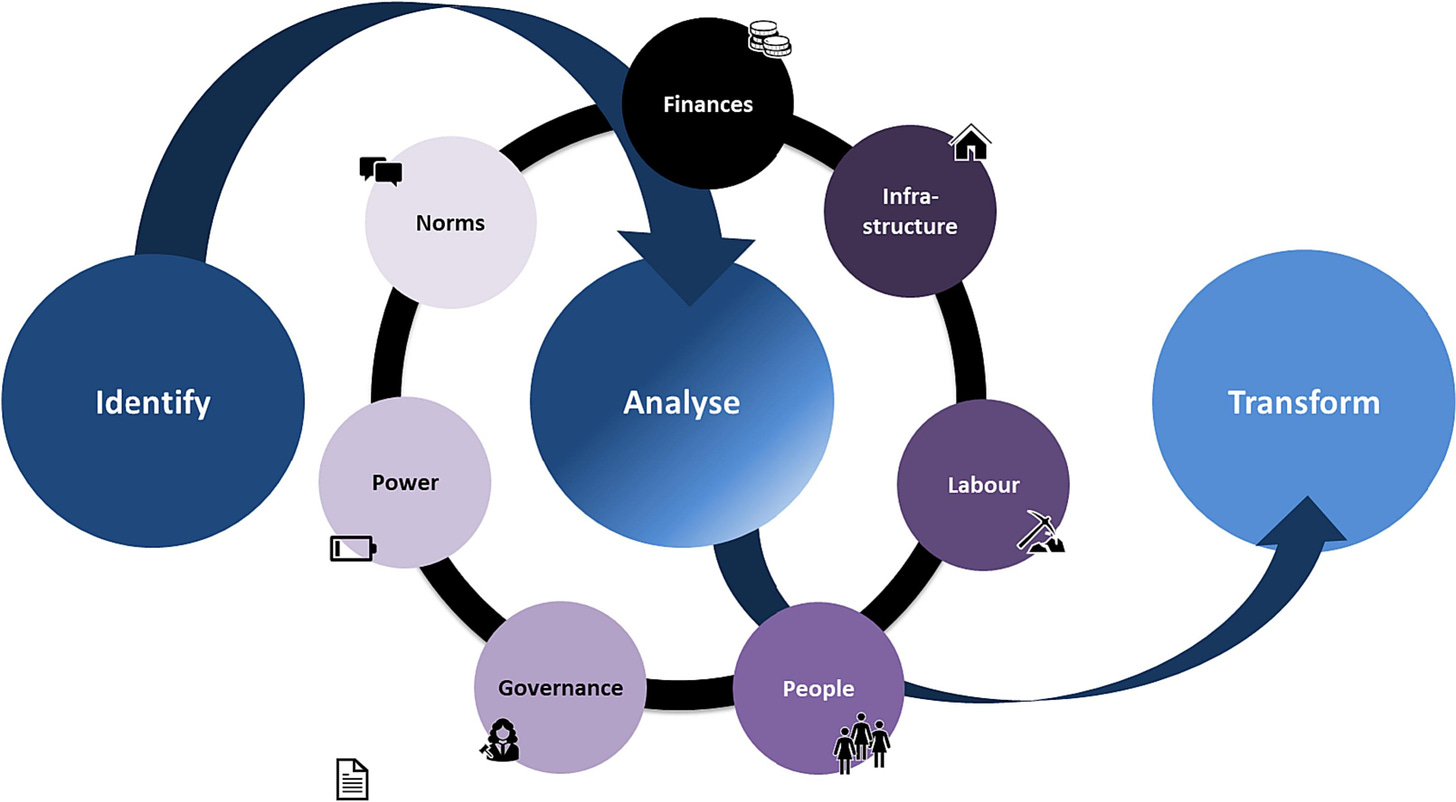
The authors discern three sources of growth dependency within our welfare systems stemming from the following dynamics: 1) growth in manifest needs, 2) labour productivity growth, and 3) the pursuit of economic rents.
The first source, growth in manifest needs, is characterised by increased demand for necessities (such as healthcare due to ageing) that outpaces improvements in labour productivity and resource efficiency.
The second source, driven by the pursuit of labour productivity growth across the economy, spawns distinct dependencies. One arises from the labour productivity trap, while another stems from Baumol's cost disease.
Continued labour productivity growth necessitates economic expansion to sustain full employment. In essence, if we can generate the same outputs with fewer work hours, we must produce more to uphold employment levels — a phenomenon known as the productivity gap. This gap is exacerbated when the lion's share of profits accrues to rentiers.
The final source, the pursuit of economic rents, can engender growth dependencies within welfare systems. Particularly, when rentiers employ costly and risky rent-seeking strategies and wield socio-political power to stymie wealth redistribution, this fosters a firm-level reliance on revenue growth.

However, they argue that growth dependencies, even in market economies, can be mitigated. These dependencies aren't inherent to our economies but are shaped by underlying structures that can be altered (see figure).
The author consider some very practical options:
Innovative ownership models that break the link between the property structure and the use of predatory financial practices;
Legislation that limits the ability to pursue unsustainable financial structures;
A transition to a completely not-for-profit social care sector, made up of social enterprise, voluntary and/or public sector providers, which would remove opportunities for rent-seeking through financial engineering altogether.
Source: Corlet Walker et al.(2024)
This should inform economic policy. Rather than ideological debates about degrowth versus green growth, it helps to address these structures to foster more resilient and less growth-dependent economies.
In the news
An intriguing new paper suggests that Artificial Intelligence (AI) isn't the limitless font of growth some envision.
Form their abstract: “Theory predicts that global economic growth will stagnate and even come to an end due to slower and eventually negative growth in population. It has been claimed, however, that Artificial Intelligence (AI) may counter this and even cause an economic growth explosion. […] Overall, our simulations suggests that an economic growth explosion would only be possible under very specific and perhaps unlikely combinations of parameter values. Hence we conclude that it is not imminent.”
Worldwide spending on the environment remained stagnant during 2001–21: From 2001 to 2021, environmental taxes, including levies on energy, resources, and pollution detrimental to the environment, consistently hovered at approximately 1.5 per cent of global GDP. Concurrently, environmental expenditures, covering pollution control, waste management, and, crucially, research and development for environmentally friendly technology, remained low at about 0.6 per cent of global GDP during this time.
An extreme 2023 in terms of weather: The WMO report confirms 2023 as the hottest year on record by a clear margin. Records are broken for ocean heat, sea level rise, Antarctic sea ice loss, and glacier retreat. This extreme weather undermines socio-economic development. On the positive side. the renewable energy transition provides hope. And it is (simple) economics: the cost of climate inaction is higher than the cost of climate action
That’s all for this week.
Take care.
Hans
The Gallup World Poll, which remains the principal source of data in this report, asks respondents to evaluate their current life using the image of a ladder, with the best possible life for them as a ten and the worst possible as a 0. Each respondent provides a numerical response on this scale, called the Cantril ladder. Typically, around 1,000 responses are gathered annually for each country. Weights are used to construct population-representative national averages for each year in each country.
See here one of the regression models. I ran quite a few of them because I had some trouble with missing variables at the beginning of the period (that is also why the start GDP is 2008). Also, in some specifications, economic growth was still significantly positive. However, the effect of the level of GDP was still significantly negative.


Fascinating! Thank you