Hi all,
Sometimes, your own body surprises you much like an economy does. Take my recent bike accident, for instance—I recovered faster than I anticipated (though the bruises are still there). And yes, I am a male, so there is always something to complain about health. However, it is reminiscent of the unexpected recovery speed in other contexts, like the global economy post-COVID or the equity market performance in 2024. Predictions about personal health or economic outcomes often miss the mark. And when reality outperforms expectations, no one seems to notice. But when things go south, the messenger—the economist or the doctor—bears the brunt of the blame.
As I’ve often discussed with my sister, a gynaecologist, the human body and the economy are complex adaptive systems. Even if you correctly diagnose the problem, treatment can still go awry. These systems operate with many interdependencies and feedback loops, allowing unseen variables to throw out even the best-informed predictions. Whether in health or economics, uncertainty remains an inevitable part of the equation.
Still, we need economic forecasts to guide policy decisions or investment decisions. That is why governments have agencies producing this stuff, and banks and asset managers hire economists. They don’t expect it to be exactly right, but it helps guide those decisions and, in the case of commercial financial institutions, also guides their clients. That is why most banks and asset managers publish their annual outlook at the end of the year. At Triodos Bank, we also do that (although a little differently, see here).
I put 10 different outlooks (just a selection of those I could find quickly) in chatGTP and asked for the main conclusions. A few things stood out:
Growth Resilience: There is broad agreement on the continued resilience of the US economy, with Europe lagging and China facing structural hurdles.
Inflation: All reports converge on inflation falling but remain sticky in core sectors, especially services.
Monetary Policy: Most agree that central banks will begin easing in 2025, depending on inflation trends.
Energy Transition: There is consensus on the necessity of green energy and infrastructure investments to meet rising demand, especially for Europe's strategic agenda (see my previous post on Draghi's report).
Reflecting on all those readings, I always think we are missing what matters. It is always about symptoms, not about root causes. And what you get is regression to the mean, a little middle of the road, concentrating on GDP figures, inflation, fiscal policies and (of course) a lot on trade and geopolitics. When you are outspoken and wrong, you will have a problem with your outlook next year. And the chance that you are outspoken and correct is minimal; you’ll get all kinds of greyish outlooks.
ChatGPT is also convenient to check your assumptions. I put several reports (including ours) and the latest forecasts of IMF, OECD and World Bank in AI and asked to calculate the average global US and eurozone growth estimates. And this is what you get. Forecasts are very close to what happened last year and aligned (the line and crosses show the maximum and minimum estimates in the sample). The difference between minimum and maximum is much lower than the historical forecasting error. In other words, you can forget the rest if you have read one.
I think (and the readers of this blog know this) that a complex adaptive system that is on the brink of collapse if we don’t take serious action needs more than discussing symptoms and economic reductionist approaches. Overall, discussing only macro numbers in an outlook does not help guide anything.
When we think about growth, many people assume it’s linear. However, economic growth is exponential, calculated as a percentage of the existing base. Consider this: in 1978, a 3% increase in economic growth per person in the Netherlands added €431 (in 2011 values) to the average Dutch income. By 2023, that same 3% growth translated into €1,320 (still in 2011 values)—a threefold increase over 45 years.
Despite this exponential compounding, a 3% growth rate is often considered “desirable,” while 1% is labelled as “meagre” (just read the economic outlooks!). Yet for the Netherlands, even a 1% growth rate today delivers the same inflation-adjusted material progress per capita as 3% did decades ago. The key takeaway: don’t underestimate the power of exponential growth. While its effects may seem negligible over short periods or minor changes, its impact over longer timelines is profound.
How we envision the future shapes our understanding of economic possibilities and limitations. I want to highlight two key points here.
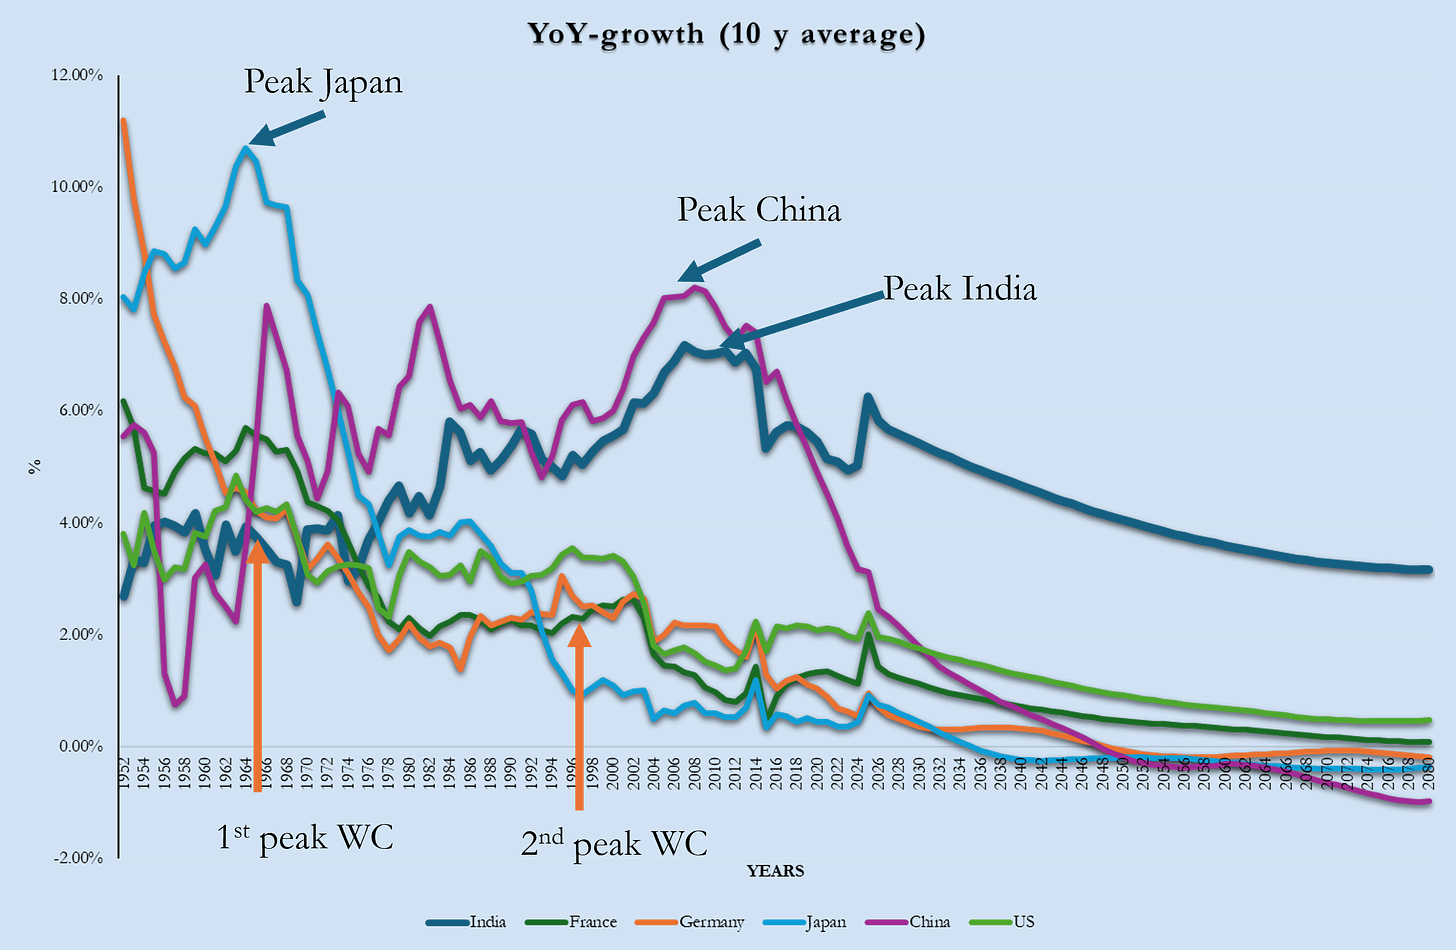
Firstly, we often overlook a fundamental reality: exponential growth cannot and will not continue indefinitely. Economic growth seems to decelerate as economies mature, a pattern observed historically in the Western world and now increasingly evident in countries like China (please refer to the figure and further explanation later in this blog). This natural transition from rapid growth to slower, stabilised expansion reflects the characteristics of an S-curve—a trajectory that many economies inevitably follow.
The problem arises when institutions, financial systems, and societal expectations are still based on assumptions of sustained high growth. As actual growth rates decline, growth-dependent structures become increasingly vulnerable, creating systemic challenges. Adapting to this reality requires a paradigm shift in designing and managing our economic systems, ensuring they are resilient and functional in a low-growth environment.
Second, economic progress and the financial outlook depend on many factors. Of course, many know this but do not consider it when writing the economic outlook. Based on an (old) framework, I have tried to present the information for 2025 in a more structured and balanced overview. I did the same with sustainability (see details below).
The conclusion is straightforward: Everything is interconnected, and we have opportunities and risks. And no, 2025 will likely not be easier than 2024. There is a lot to worry about and look forward to. Can we speed up the energy transition? Can we use AI for good? Will some wars end in 2025?
I won’t end this reflection with a tidy conclusion, a doomsday prophecy for 2025, or overly hopeful platitudes. Let’s take this: our economy operates as a complex adaptive system that can only stabilise if its structural growth dependencies are met. And 2025, like the years before and after it, is unlikely to resolve this fundamental tension.
Growth, opportunities and risks
I’ve been reflecting on long-term economic growth and revisiting the hypothesis that we’ve already passed “peak growth.” If that’s true, the future may look vastly different from the past—ushering in a shift that challenges deeply entrenched assumptions about progress and prosperity.
I want to make two points here. First, we should examine economic growth and what we see as usual. Second, we should consider the complexities of making actual forecasts and factors that should be considered in the long and short run.
S-curve growth
There is no shortage of understanding of past economic growth. Take, for example, this recent paper on unified growth theory. Unified Growth Theory (UGT) provides a comprehensive framework to understand the transition of societies from long periods of economic stagnation to sustained economic growth. It seeks to unify the study of historical and contemporary economic development by explaining the forces that underlie this transformation. UGT centres on the intricate interplay between technological progress, population dynamics, and human capital accumulation, demonstrating how these factors evolved over time to shape the modern world.
In the pre-modern Malthusian era, technological advancements led to increases in population rather than per capita income. Resources were constrained by the size of the population, which absorbed the gains from productivity improvements. Over time, however, technological progress gradually accelerated, increasing the demand for skilled labour. This demand triggered a demographic transition: fertility rates declined, and families began to invest more in fewer children's education and human capital. This demographic shift marked a crucial turning point, breaking the link between population growth and resource constraints.
As fertility rates fell, investments in human capital intensified, creating a feedback loop with technological innovation. This interaction catalysed sustained economic growth as societies shifted their focus from quantity (population) to quality (human capital and technological advancements). UGT also considers the divergence in economic outcomes between nations, attributing disparities to the timing of transitions and the influence of factors such as institutions, geography, and culture.
In essence, Unified Growth Theory captures the complex dynamics of historical development and offers a lens to understand the persistence of inequality and the conditions necessary for ongoing economic progress. Integrating demographic, technological, and institutional changes into a single narrative provides a holistic explanation of how the modern growth era emerged from the past stagnation.
While this theory explains how humanity transitioned to sustained economic growth, it leaves open-ended questions about whether growth is genuinely limitless. The framework implies that growth depends on continuous technological progress and effective management of resources and inequalities (as does the endogenous growth theory). Still, it also does not take ecological limits into account.
We seem to have forgotten that the golden days of growth are over in almost all countries (all Western countries, but also in India). Growth can never continue exponentially. Even not linearly. That is also what Vaclac Smil, in his book Growth argues.
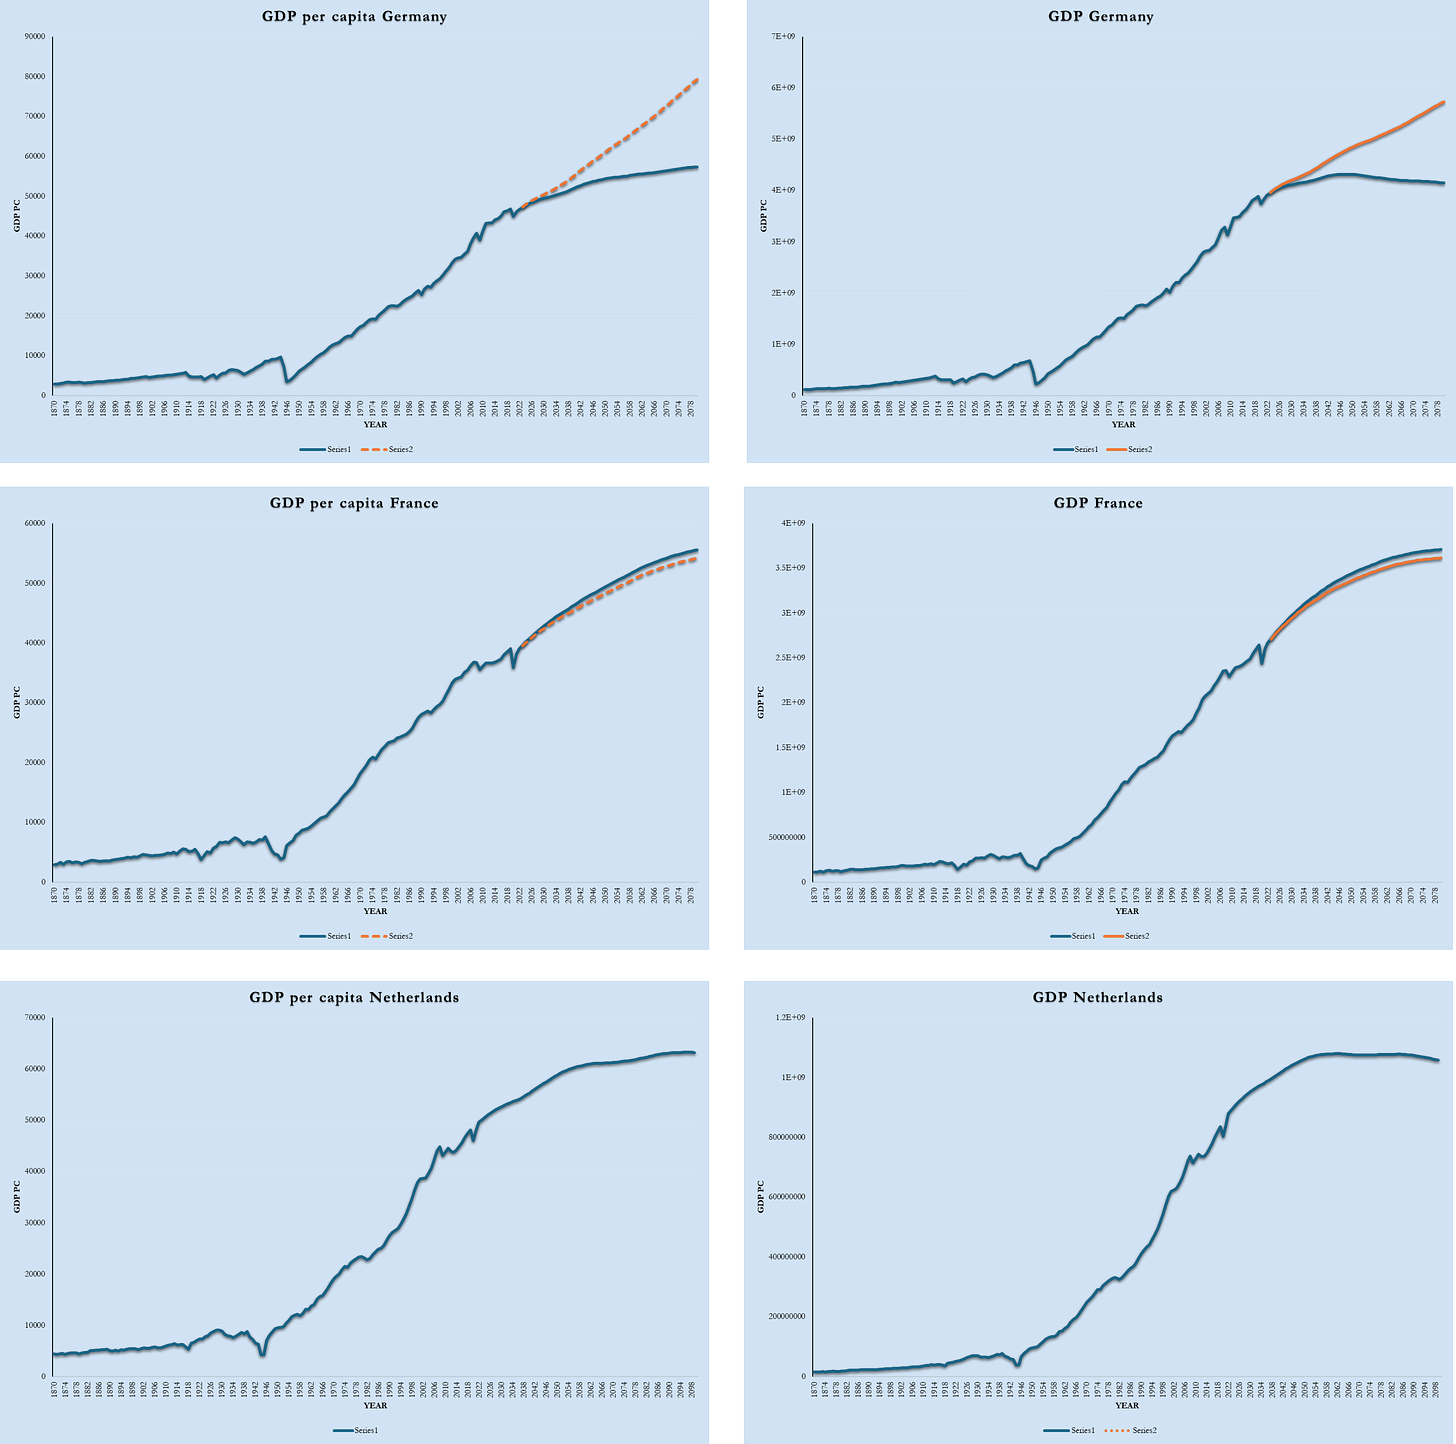
To give this more body than ‘just saying’, below you’ll find the economic growth trajectories for a few (large) countries (and the Netherlands - always keep your home bias), over 1870-2080. Historical data is from the Maddison Data Project. Forecasts are based on the World Bank Long-term Growth Model. If you see orange lines, I made my assumptions that differ from the standard assumptions in the models. Of course, we observe different stages and developments here. The difference between the left-hand (GDP per capita) and right-hand (GDP) figures is demographic development and labour force participation.


The figures for Germany (in the model was the dotted orange line) seem overly optimistic). India is a special case: still in its exponential phase. However, all (even India!) have passed the inflexion point of maximum growth figures (peak growth).
The peak growth in Japan was in the early sixties. The Western world (I did not include all the countries — it got too messy) had two peaks: one in the sixties and one just before the turn of the century. China peaked in around 2010, and India a few years later. For the coming decades, no one expects economic growth to return to those peak levels (see also this World Bank report). To be very explicit here, the forecasts are made with standard economic tools, not taking, for instance, climate change into account. Without any decisive action, this could easily lead to massive, unanticipated degrowth (see, for instance, this Nature article highlighting that climate change could lead to an income (and hence GDP) reduction of 19% globally in the next 26 years).
Even without accounting for external factors, ‘within-system’ economic growth often follows a nonlinear S-curve (sigmoid) trajectory, as Vaclav Smil notes. This observation is significant. We risk creating systemic challenges if we continue to expect growth to remain at peak levels and build our institutions, financial systems, and corporate profit models on outdated assumptions.
This is even more important for a blog called Tipping Point Economics: if we have nonlinear growth trajectories, we also have different sustainable states of the economy and tipping points. So, there are no straight lines of predictable economic growth here.
This concept is particularly vital for a blog called Tipping Point Economics: nonlinear growth trajectories imply the existence of multiple sustainable states for the economy and critical tipping points. In other words, economic growth does not follow straight, predictable lines. Instead, it can shift dramatically, transitioning between states depending on systemic pressures and thresholds. Recognising this dynamic nature is essential for understanding and navigating the complexities of modern economic systems.
Growth and outlook complexities
Second, I came across this old article while reading the fabulous book by Vaclac Smil. The table below states perfectly why outlooks quite often miss the point. Economic growth is complex and depends on many factors, and causality can run in two ways. They grouped all the linkages into nine groups, leading in total to 55 interactions, which can be strong (black), bi-directional (two arrows), one-way (one arrow) or weak or non-existent (hollow circle). Most forecasters take only cells 1, 2, 3, 6, 8, 10 and 19 into account, especially when looking at the short term. I contend that using this matrix to forecast 2025 would give a more balanced approach.
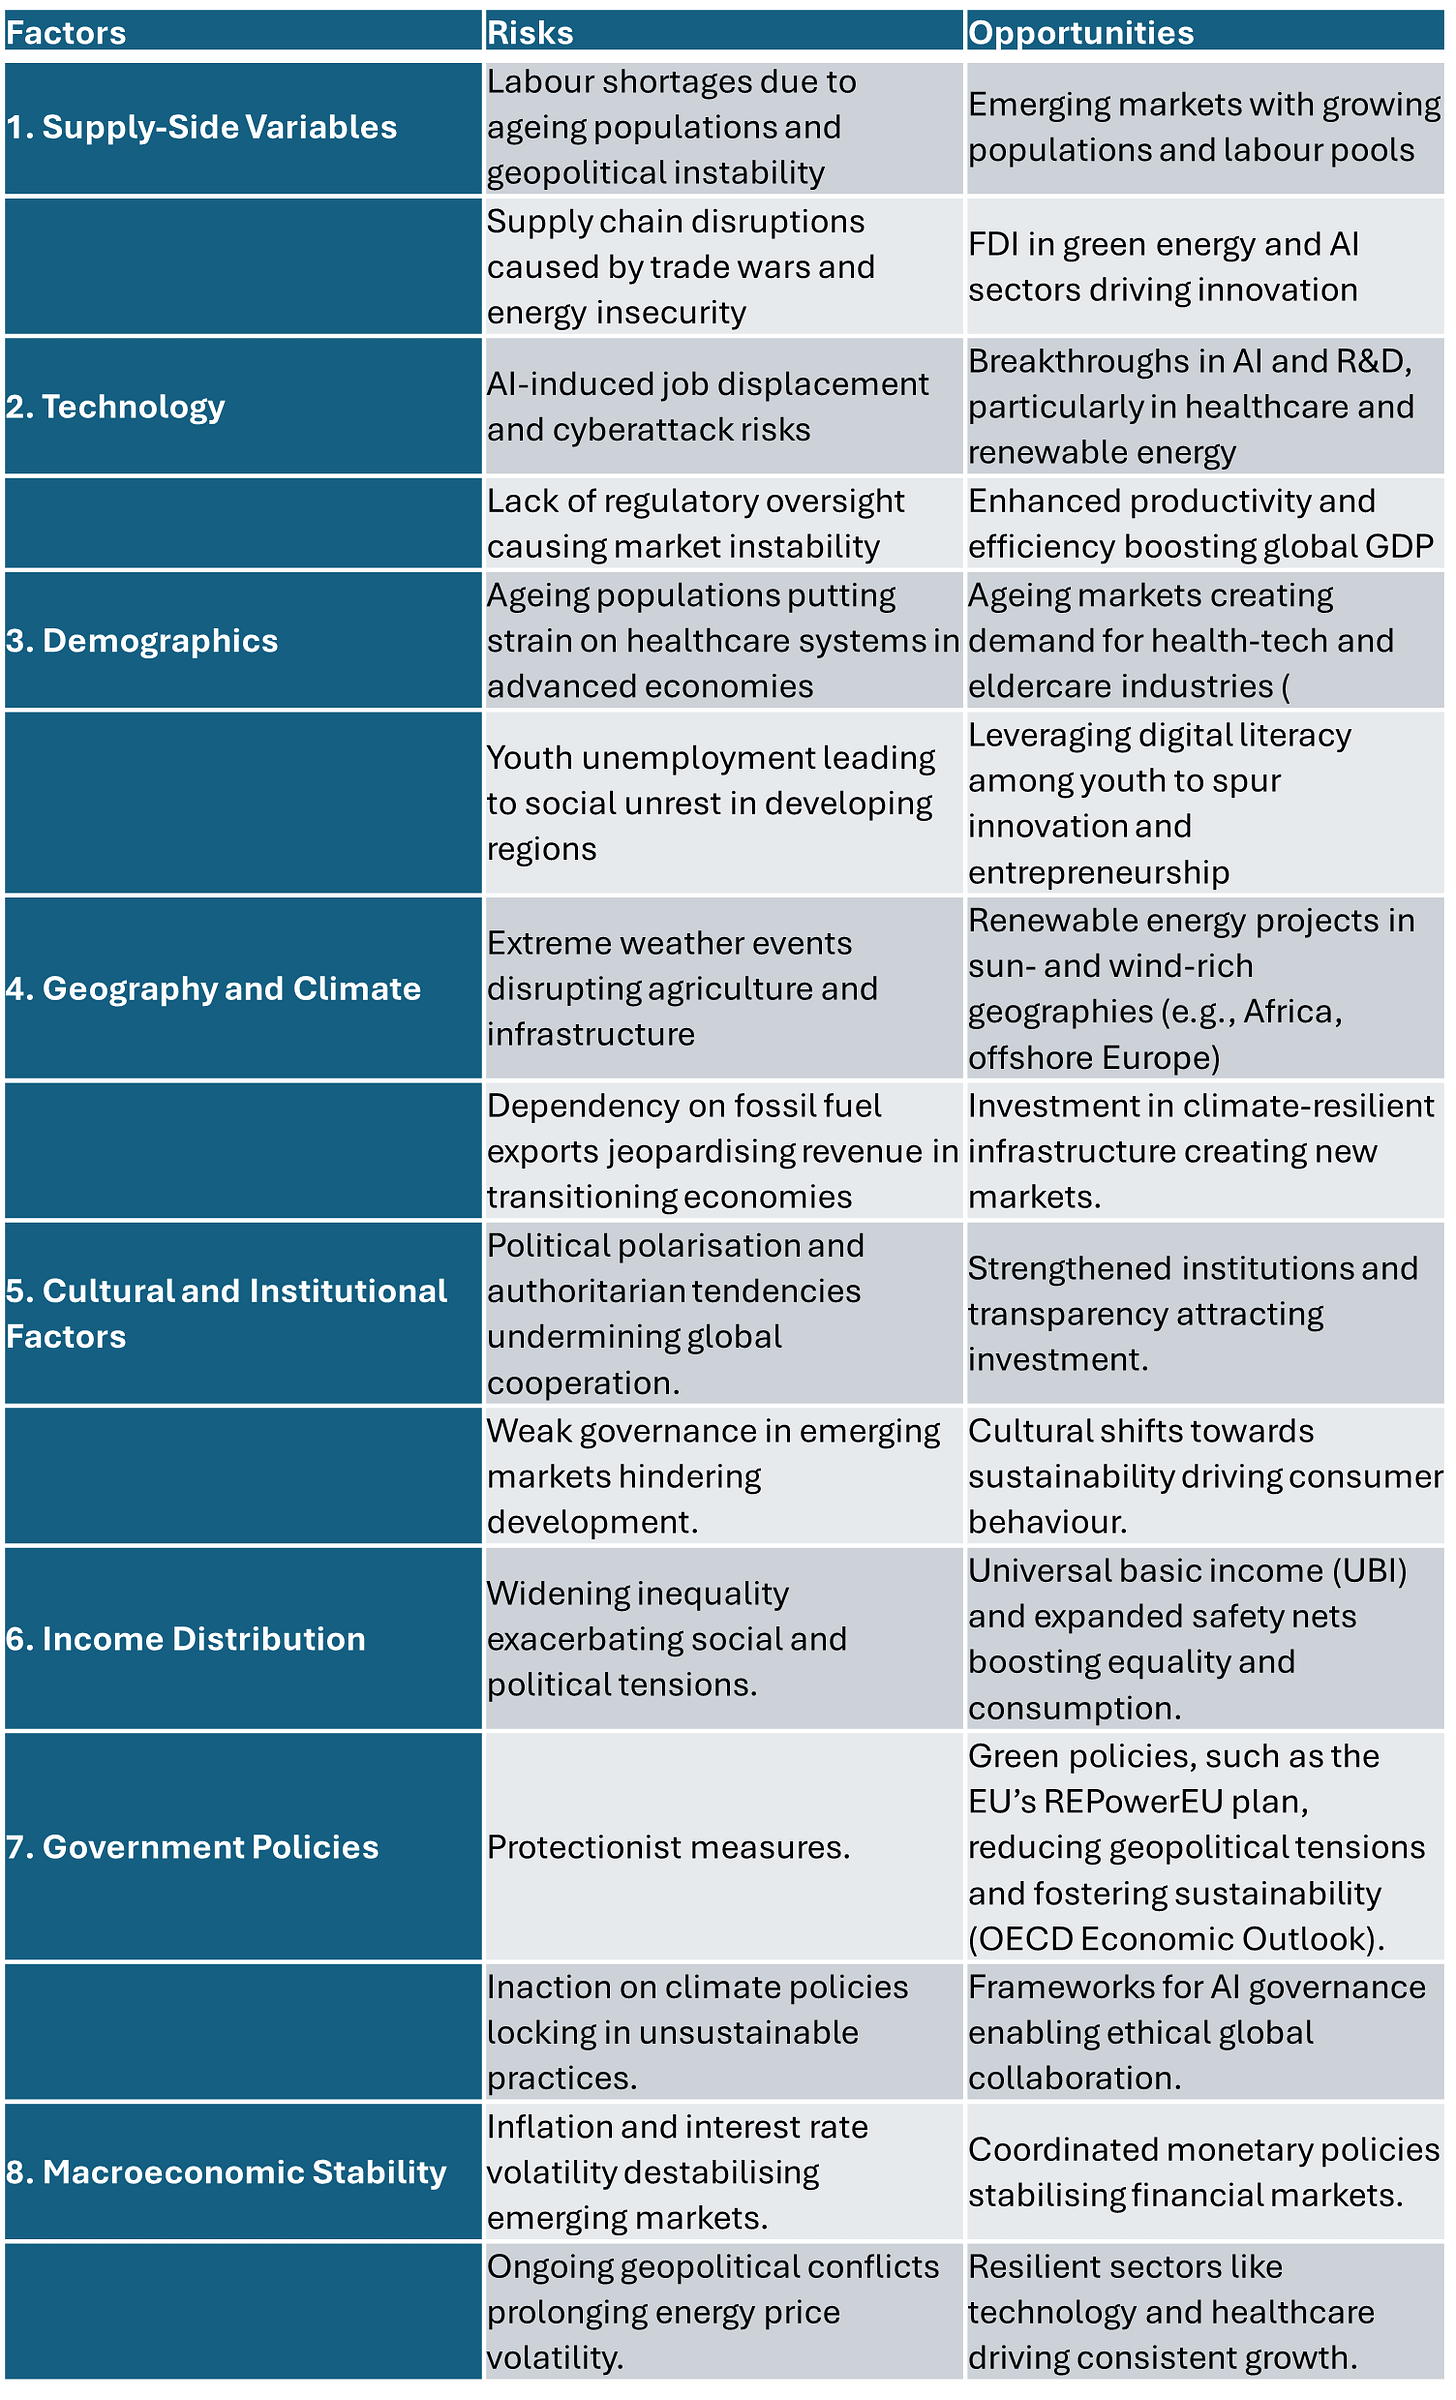
So, that is what I did. With the same info (the outlooks, IMF, World Bank, OECD), I analysed the biggest risks and opportunities with AI. See the table below. Is this more informative? Yes, because it shows the complexities of interactions. Does it help to judge better what 2025 will bring? Not fully. It does not give insights into the importance of government actions (from trade wars to sustainability policies), but it does (of course) not help to give a better point estimate of GDP growth.
However, it gives a better understanding of the interdependencies. The interconnectedness of the factors driving economic and sustainability outcomes underscores the complexity of managing risks and leveraging opportunities. Each factor is deeply entwined with others, creating ripple effects across the system. For instance, technological advancements (Factor 2) can mitigate climate risks (Factor 4) through innovations in renewable energy and carbon reduction, yet they may also exacerbate labour displacement (Factor 1) by accelerating automation.
Systemic challenges like inequality (Factor 6) and geopolitical instability (Factor 5) often span multiple domains, reinforcing the need for integrated responses that address root causes rather than symptoms. These risks can undermine efforts to achieve sustainability unless tackled comprehensively, with solutions designed to bridge the gaps between sectors.
Opportunities, however, often emerge from the alignment of factors. For example, investments in renewable energy (Factor 4) can support macroeconomic stability (Factor 8) by reducing dependency on volatile fossil fuel markets while also creating technological and geographic synergies. Harnessing these intersections is essential for fostering resilient, equitable, and sustainable systems.
A last exercise that I did was to fill the same table but then for a sustainability outlook (See table).
The interconnected nature of risks and opportunities underscores the complexity of achieving sustainability. Technology (Factor 2) serves as both a challenge and a solution, amplifying unsustainable practices through energy-intensive innovations like cryptocurrency mining or enabling breakthroughs in renewable energy and ecosystem conservation. Similarly, Demographics (Factor 3) present a dual challenge: Population pressure strains natural resources, yet younger generations offer immense potential to drive green innovation through their demand for sustainability-focused solutions and policies.
Policies (Factor 7) are critical leverage points for sustainability. They are crucial for aligning economic incentives with sustainability goals. Well-designed policies can accelerate the green transition, while their absence risks stagnation. Meanwhile, geography and climate (Factor 4) play a central role. Climate impacts—ranging from extreme weather to biodiversity loss—reverberate across all other factors, influencing technology, population dynamics, and institutional stability.
Actionable pathways to address these dynamics include strengthening international collaboration on climate goals to ensure a unified response to global challenges. Equitable access to green technologies and infrastructure is essential to empowering communities and nations to participate in the sustainability transition. Finally, investing in resilience-building strategies, particularly in vulnerable geographies most affected by climate change, is critical to securing a sustainable and equitable future.
When we combine insights from the sustainability and economic tables, the interconnectedness of these challenges and opportunities becomes even more apparent. For instance, while artificial intelligence may drive economic growth through innovation and efficiency, its energy demands and potential for exacerbating inequality can hinder sustainability. Similarly, demographic changes reveal a dual-edged reality: more people can contribute to economic growth, yet this also means more resource consumption, environmental pressure, and mouths to feed.
I won’t end this reflection with a tidy conclusion, a doomsday prophecy for 2025, or overly hopeful platitudes. Let’s take this: our economy operates as a complex adaptive system that can only stabilise if its structural growth dependencies are met. And 2025, like the years before and after it, is unlikely to resolve this fundamental tension.
Perhaps, as with my fall and the conversations I’ve had with my sister, this diagnosis is entirely off-track. I don’t believe so, but that possibility remains.
Have a good new year.
Hans


